Sheet A — Survey Records

Projects / 13

Case studies in applied spatial analytics — network analysis, climate risk, renewable siting, market intelligence, and spatial data products — from Los Angeles County to the Indonesian archipelago.

13 / 13 RECORDS
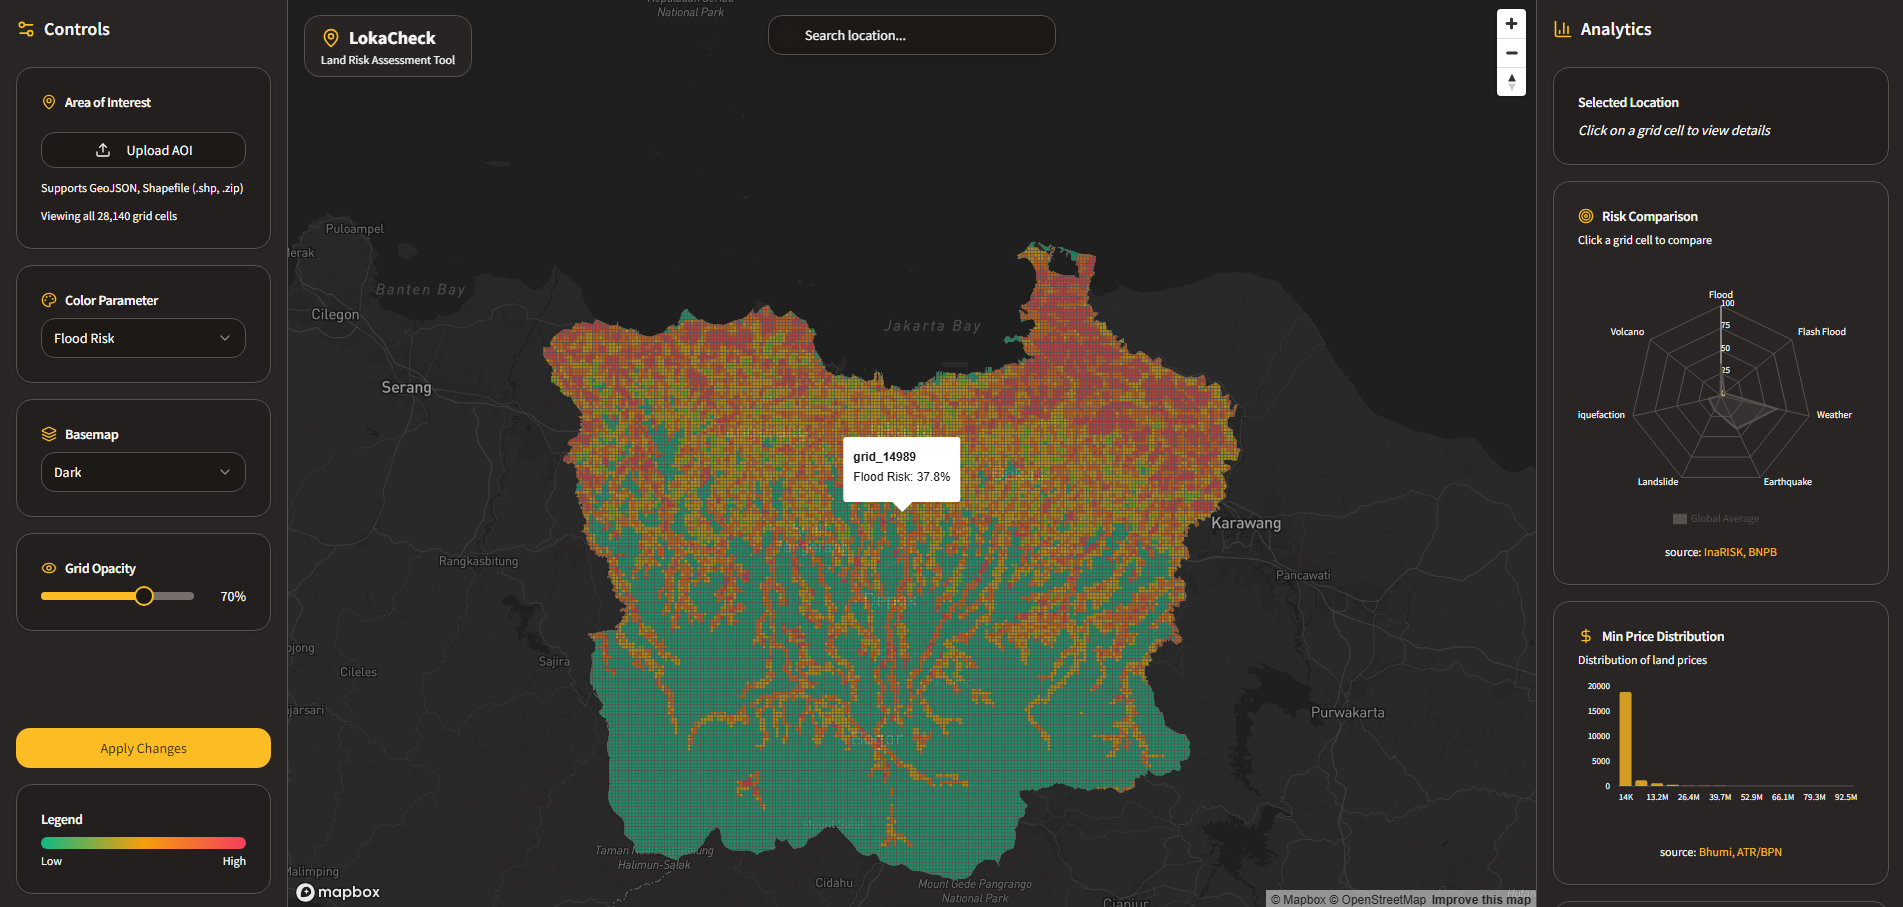
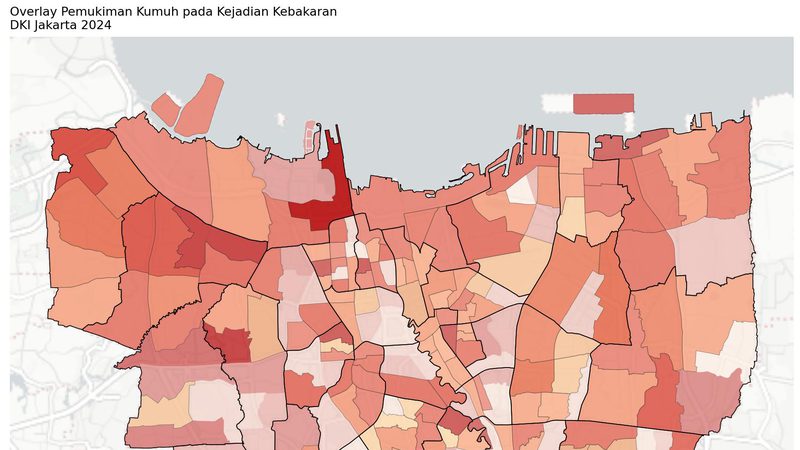
LokaCheck multi-hazard risk layers across IndonesiaLIVE APP
REC 0022024

LokaCheck — Climate Risk Web App

-2.5° S · 118° E · INDONESIA (NATIONAL)

Interactive web application for real-estate developers navigating disaster and climate risk across Indonesia — flood, earthquake, landslide, and volcano layers combined with land price overlays. Built at Datakota.

Web AppClimate RiskReal EstateDatakota
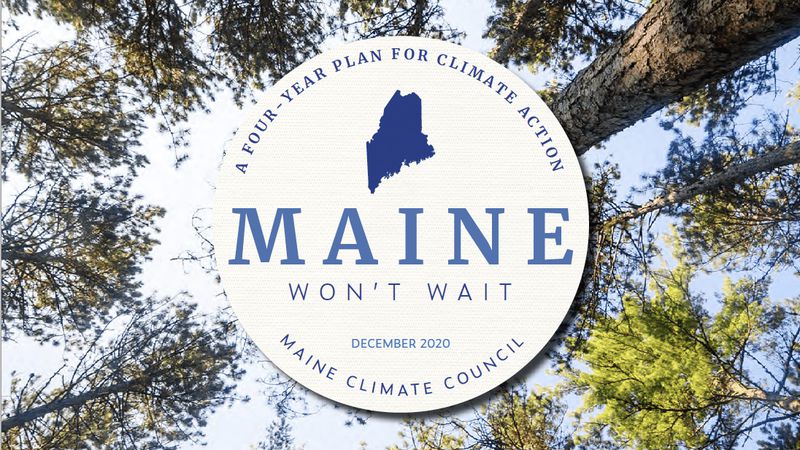
Solar suitability analysis along Maine's I-95 corridorSTORYMAP
REC 0032024

Renewable Energy Siting — Maine

45.25° N · 69.44° W · I-95 CORRIDOR, USA

Spatial suitability analysis identifying optimal solar PV sites along Maine's I-95 corridor — modeling slope, aspect, and solar radiation to support the state's 80% renewable energy target by 2030.

Suitability ModelingSolar PVRaster Analysis
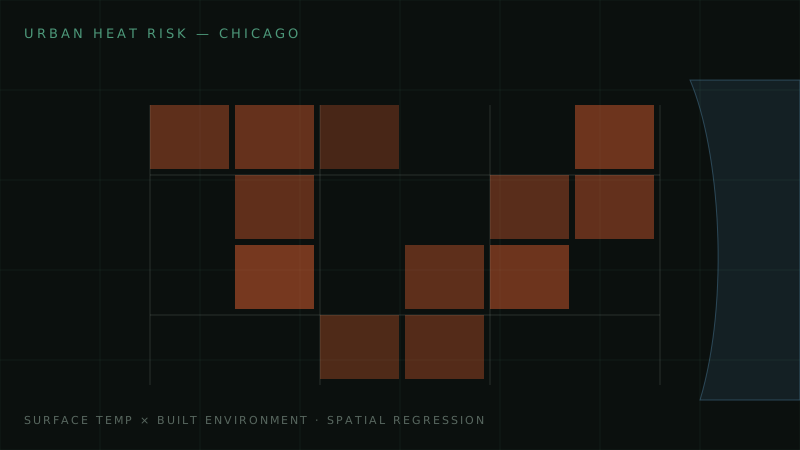
Urban heat risk grid analysis of ChicagoRESEARCH
REC 0042025

Urban Heat Risk — Chicago

41.88° N · 87.63° W · CHICAGO, USA

Spatial analysis of relationships between built environment features and extreme heat vulnerability. Proposed green infrastructure and zoning strategies for the highest-risk neighborhoods.

Urban HeatSpatial RegressionPolicy Design
In progress
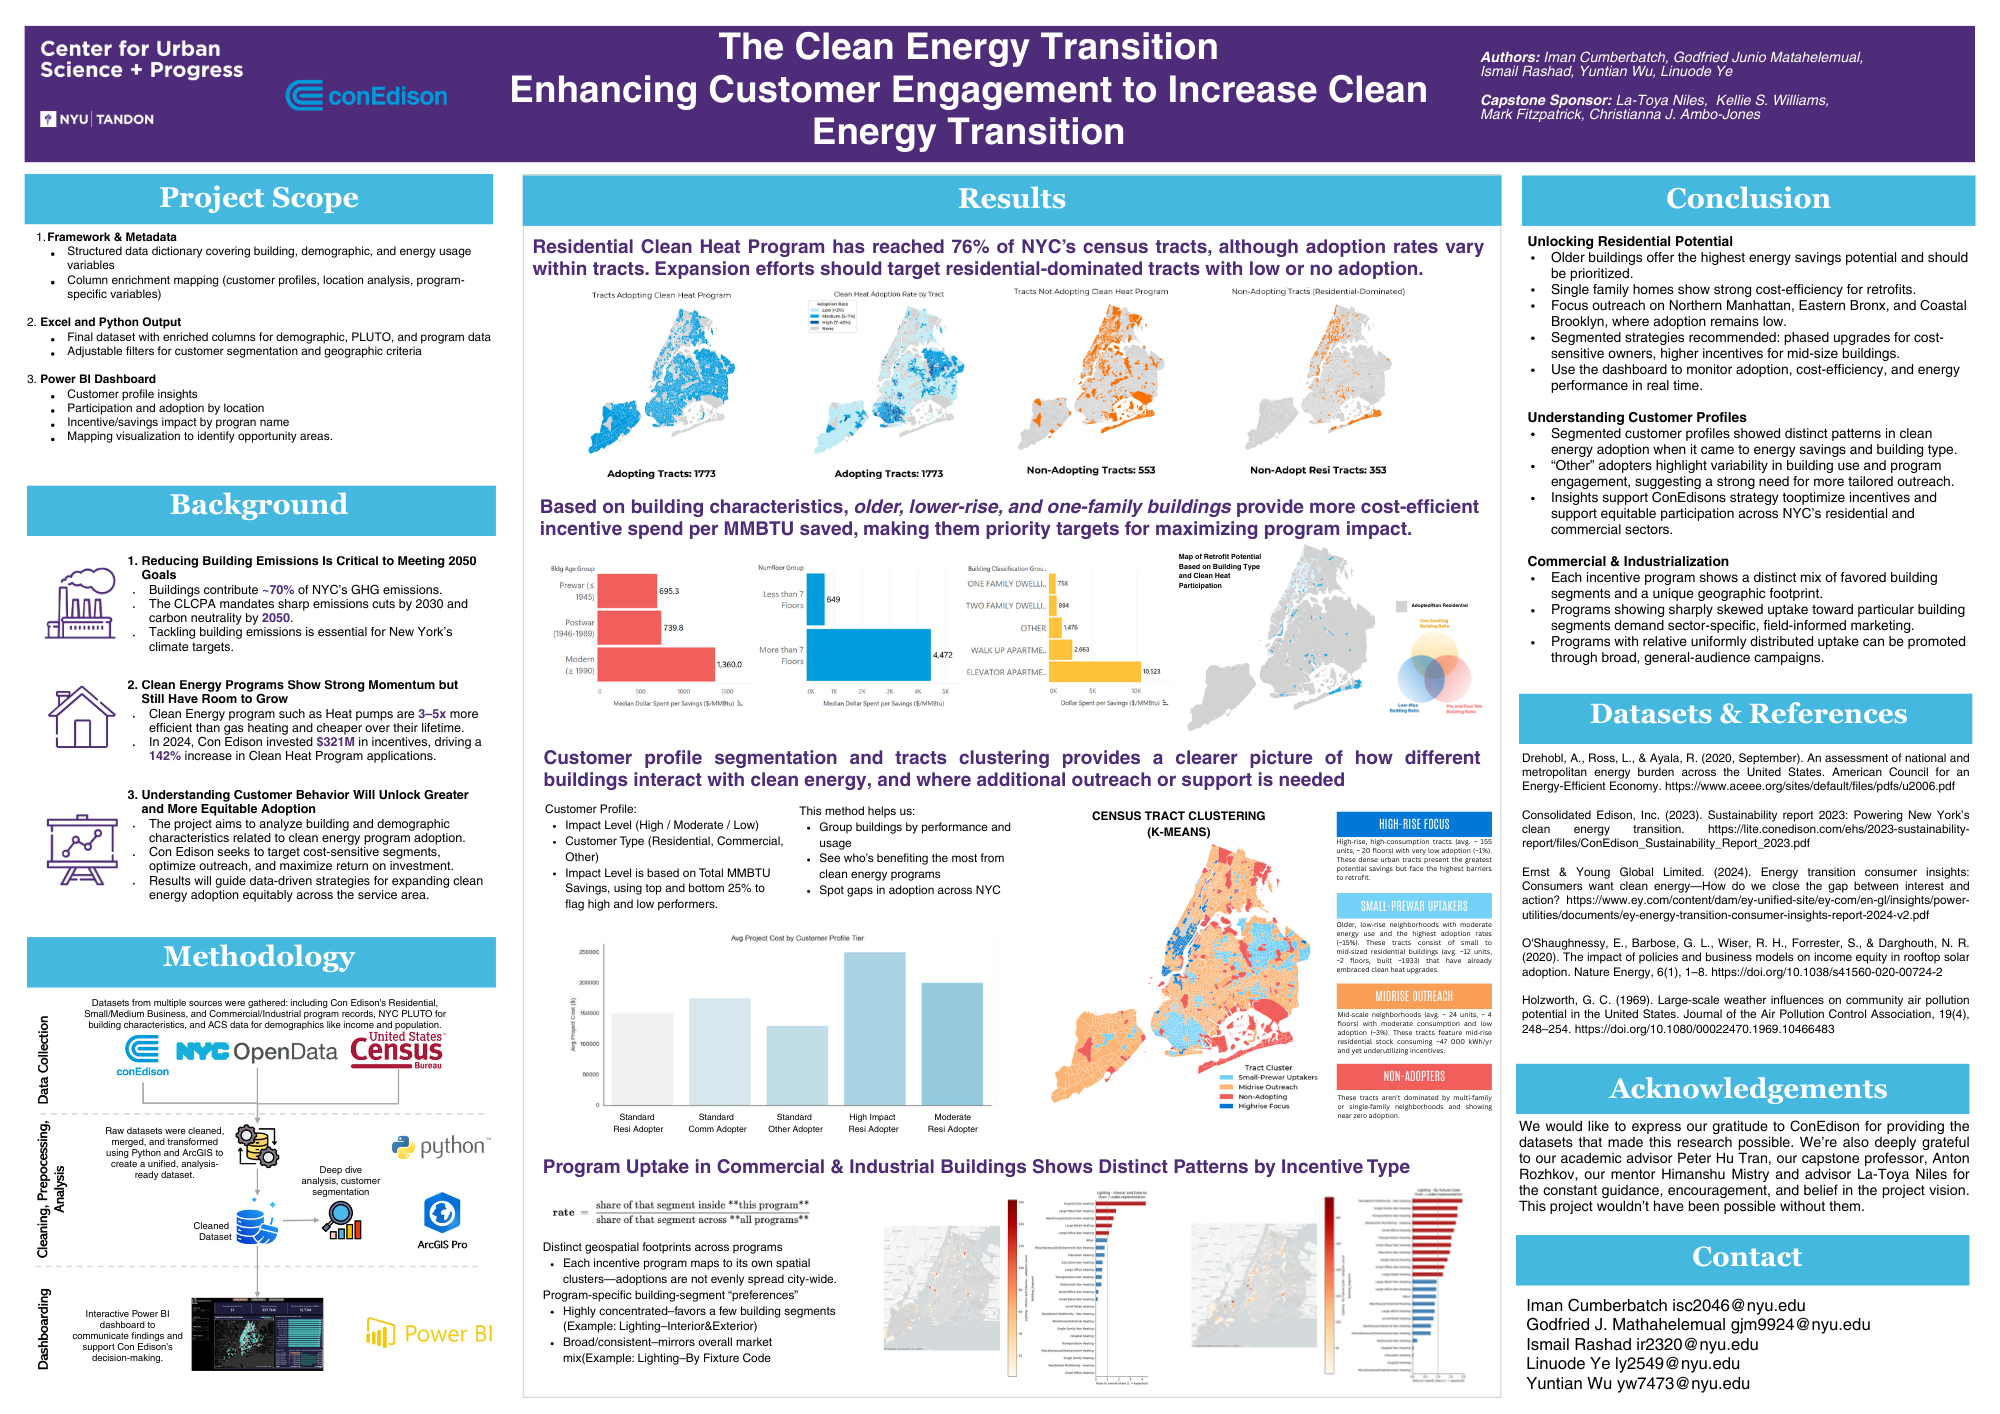
Clean energy adoption choropleth of NYC census tractsCLIENT · CON EDISON
REC 0052024–25

NYC Clean Energy Adoption Dashboard

40.71° N · 74.00° W · NYC, USA

Clean energy adoption analysis across 2,325 census tracts; identified 353 low-adoption tracts as predominantly residential. Power BI dashboard integrating adoption rates, building-type cost efficiency, and demographics.

Clean EnergyPower BICensus Tracts
Client project
Coastal climate vulnerability bands for Indonesian citiesCLIENT · DATAKOTA
REC 0062024

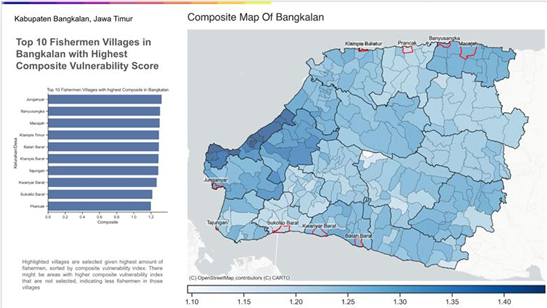
Climate Vulnerability Index — 10 Coastal Cities

-6.1° S · 106.8° E · COASTAL INDONESIA

Composite vulnerability index for 10 Indonesian coastal cities using a hazards–exposure–adaptive-capacity framework, delivered for NGO and civil society clients to prioritize climate adaptation investment.

Climate RiskComposite IndexIndonesia
Client project
Catchment rings and competitor mapping for a restaurant clientCLIENT · DATAKOTA
REC 0072024

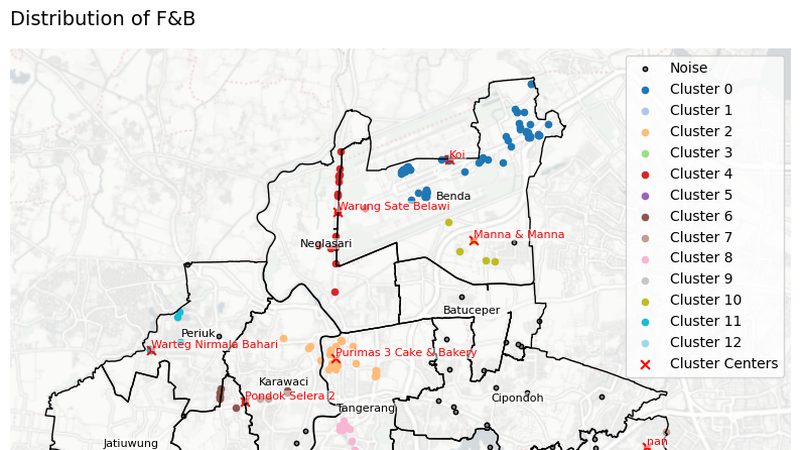
B2B Market Analysis — Restaurant Profiling

-6.2° S · 106.8° E · JAKARTA, ID

Catchment zone estimation, demographic customer profiling, competitor spatial benchmarking, and quantitative menu pricing validation for an Indonesian restaurant client.

Catchment AnalysisMarket ResearchF&B
Client project
Spatia SaaS platform with RTR viewer and site profiling toolsSAAS PRODUCT
REC 0082023

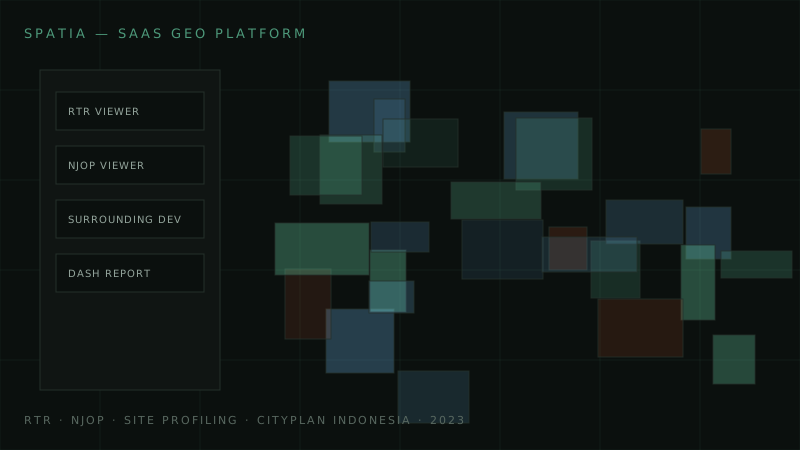
Spatia — SaaS Geo-Analytics Platform

-6.2° S · 106.8° E · INDONESIA (NATIONAL)

Worked with the engineering team on product features and UI — RTR viewer, NJOP viewer, surrounding development, dash reports. Handled customer training, admin, and nationwide data onboarding for clients in food retail and smartphone distribution.

Product DevelopmentSaaSCustomer TrainingCityPlan
CityPlan Indonesia
Hexagon tier suitability map for dental clinic expansion in JabodetabekCLIENT · SATU DENTAL
REC 0092023

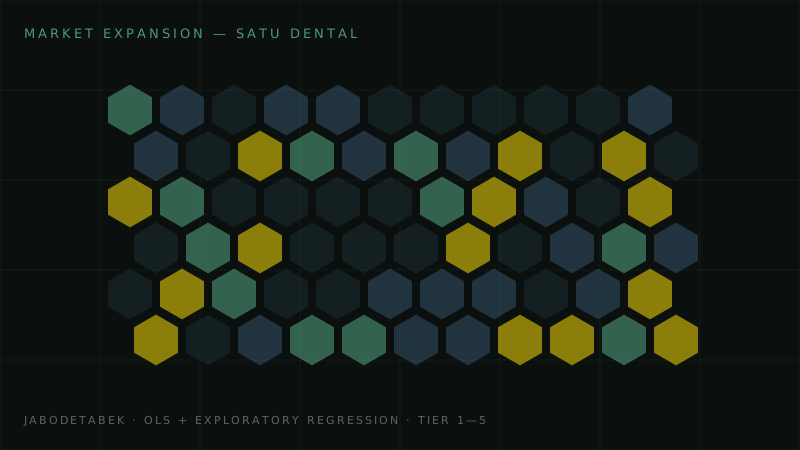
Market Expansion — Premium Dental Chain

-6.3° S · 106.8° E · JABODETABEK, ID

Location intelligence for Satu Dental's expansion across Jabodetabek — store-performance evaluation with OLS and exploratory regression, tiered hexagon suitability mapping, and market identification in both urban and rural areas.

Site SelectionRegressionHealthcareCityPlan
Client project
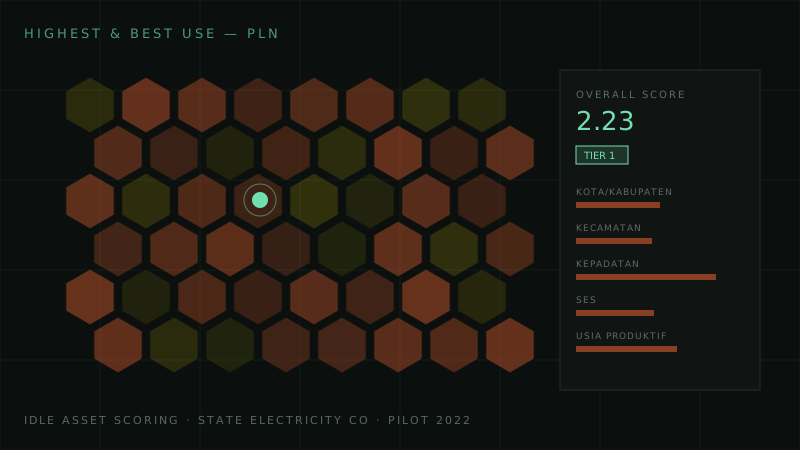
Asset scoring dashboard for PLN highest and best use pilotPILOT · PLN
REC 0102022

Highest & Best Use Pilot — State Electricity Company

-7.4° S · 109.2° E · JAWA TENGAH, ID

Highest-and-best-use analysis of idle assets for Indonesia's state-owned electricity company (PLN) — spatial scoring dashboard, research, and pitch combining density, socioeconomic class, and productive-age population layers.

HBU AnalysisAsset OptimizationDashboardCityPlan
Pilot project
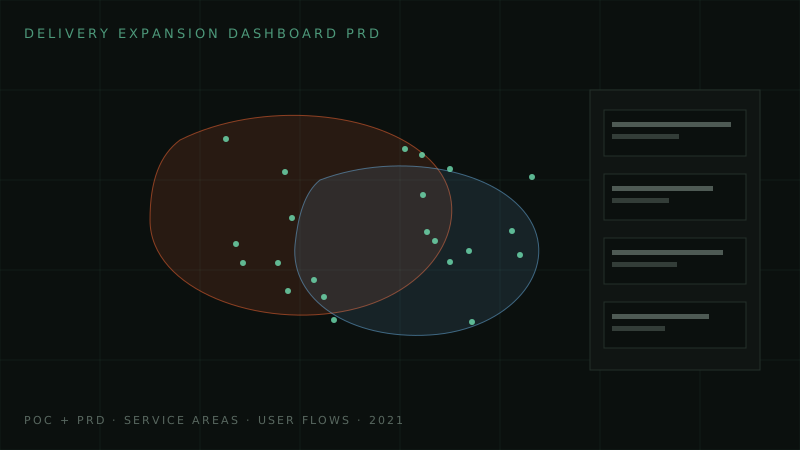
Service area map and dashboard wireframe for delivery expansion PRDPOC + PRD
REC 0112021

Delivery Service Expansion Dashboard — PRD

-6.2° S · 106.8° E · JAKARTA, ID

Proof-of-concept and product requirement document for a delivery service company's market expansion dashboard — feature definitions from user problems and acceptance criteria, user flows, and developer collaboration through delivery.

Product RequirementsUser FlowsDashboardsCityPlan
Client project
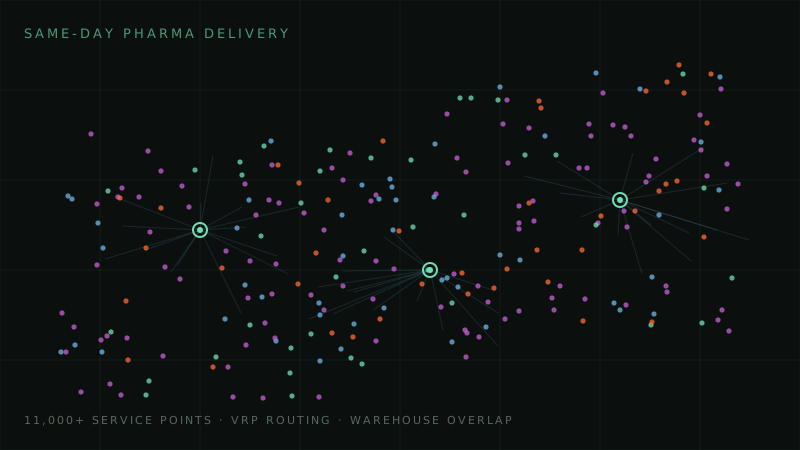
Service point cloud and hub routing for pharma same-day deliveryOPTIMIZATION
REC 0122021

Same-Day Pharma Delivery Optimization

-7.5° S · 110.0° E · JAWA, ID

Geocoded and deduplicated the client's nationwide customer database, analyzed warehouse service-area overlaps with build/close recommendations, and built vehicle-routing-problem schedules — comparing branch expansion against fleet investment.

VRP RoutingLogisticsGeocodingCityPlan
Client project
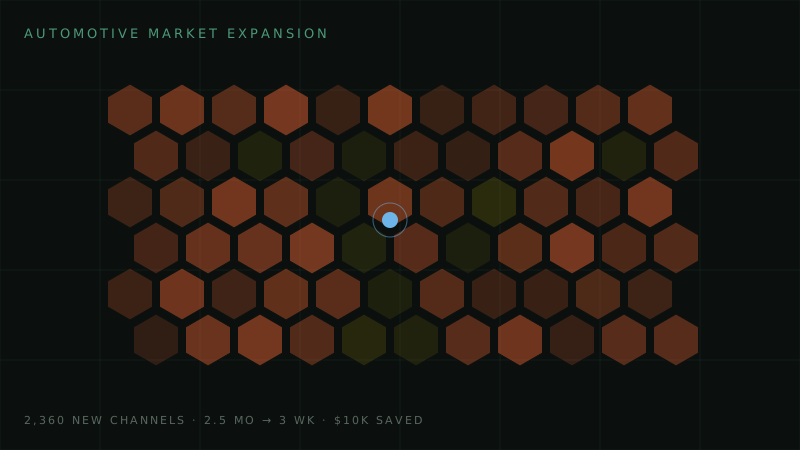
Hexagon market scoring map for automotive expansionCLIENT · AUTOMOTIVE
REC 0132021

Business Expansion — Automotive Company

-7.4° S · 109.2° E · JAWA TENGAH, ID

Suitability modeling with competitor and channel mapping for an automotive client's WebGIS-driven expansion — surfacing 2,360 potential channels, cutting expansion time from 2.5 months to 3 weeks, and saving $10K in survey costs.

SuitabilityWebGISChannel MappingCityPlan
Client project
TRANSMIT

Have a spatial problem worth solving?

These case studies are a sample — I take on consulting engagements across climate, mobility, energy, market intelligence, and spatial data products.

See services